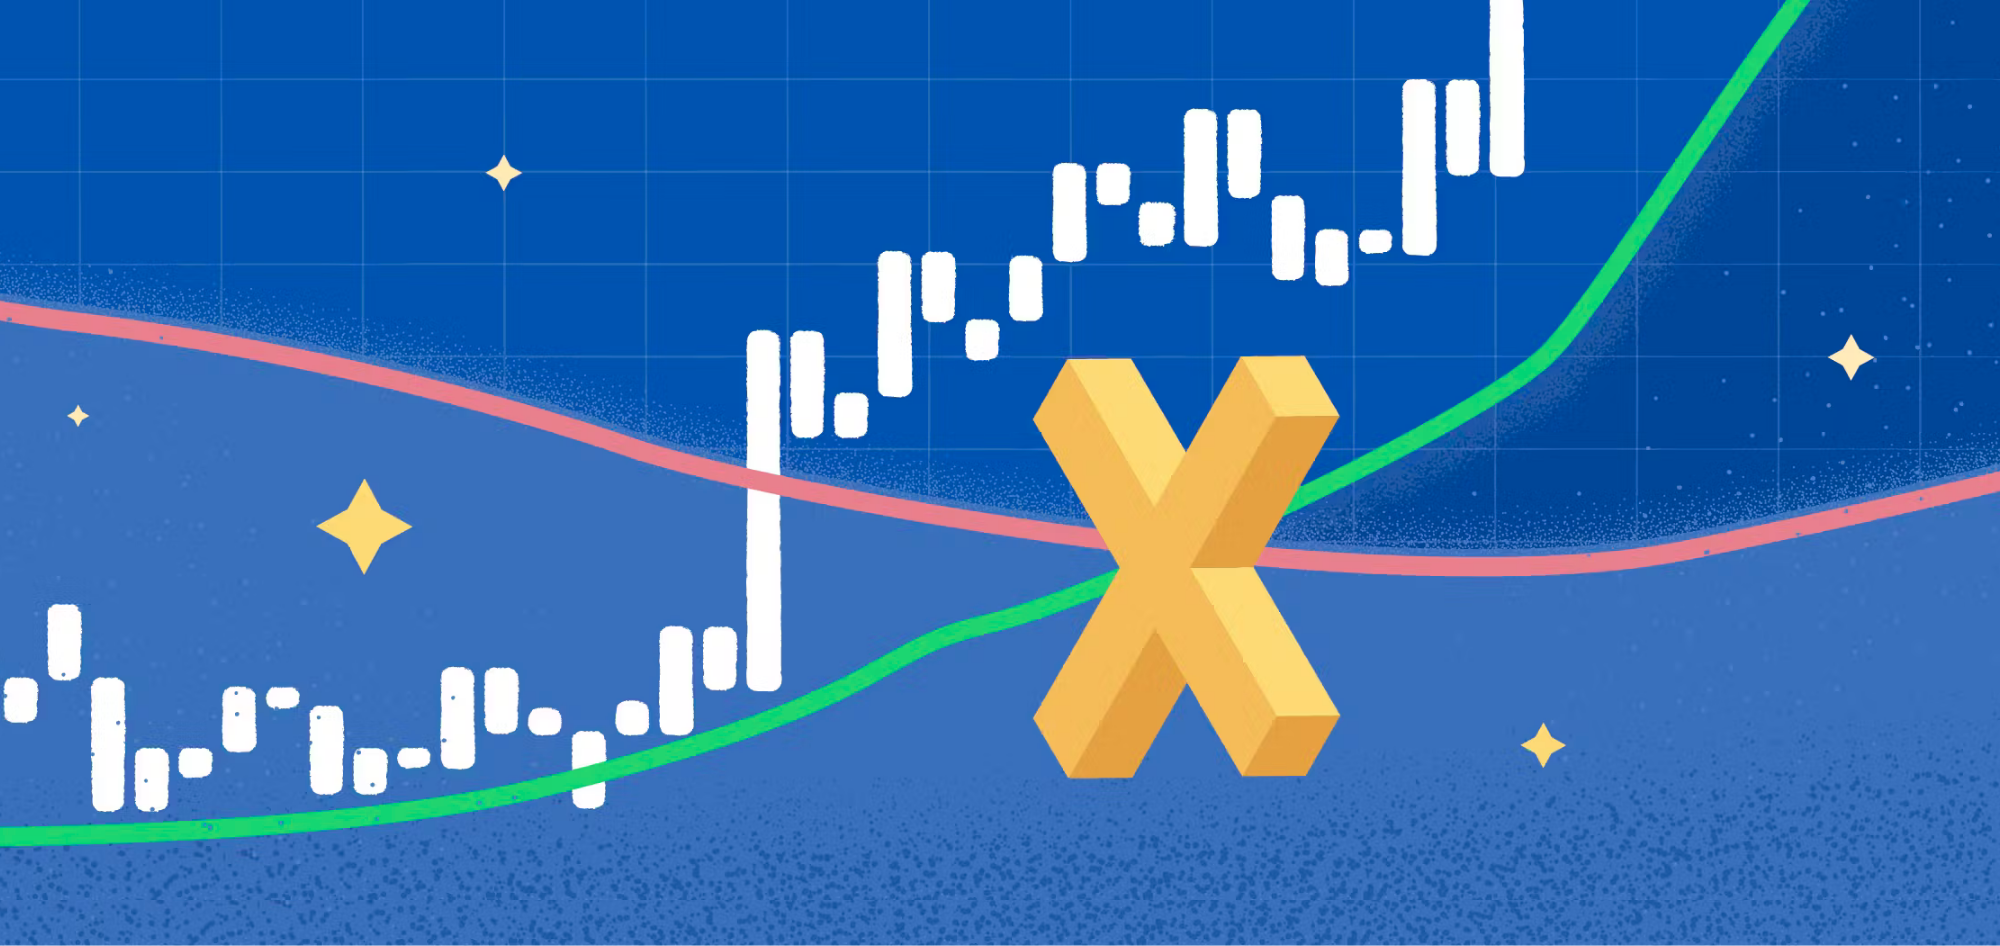
In the world of technical analysis, few signals spark as much interest—or optimism—as the Golden Cross. It’s a moment that has historically preceded strong market rallies, and recent headlines suggest it may be reappearing on charts from the ASX 200 to the S&P 500. But what exactly is a Golden Cross, why does it matter, and how can investors position for it?
In this edition of Market Moves, we’ll unpack the mechanics of this powerful technical indicator, look at historical performance across global and Australian equities, and outline actionable strategies to take advantage of potential upward momentum.
What is a Golden Cross?
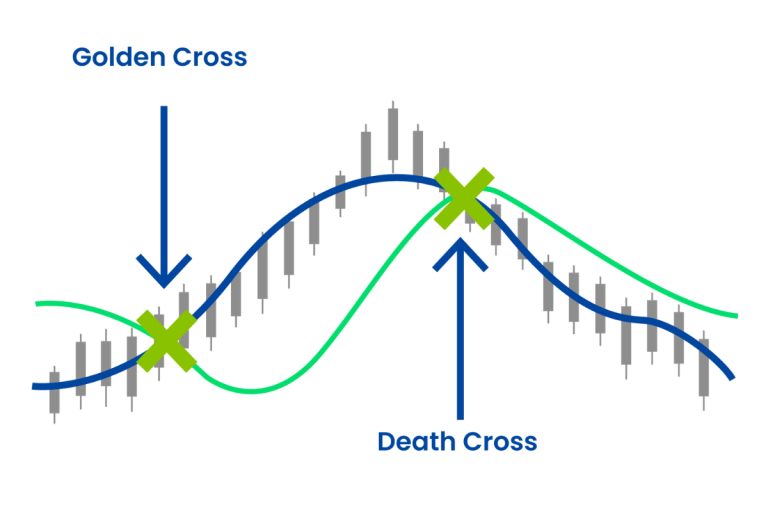
A Golden Cross occurs when a short-term moving average (typically the 50-day) crosses above a long-term moving average (typically the 200-day). It’s interpreted by technical analysts as a bullish signal—a potential turning point from bearish or sideways markets to sustained upward trends.
Conversely, a Death Cross—when the 50-day drops below the 200-day—is seen as bearish.
The logic is simple: if short-term momentum is gaining relative to long-term averages, markets may be shifting into a new uptrend.
Why the Golden Cross Matters
Golden Crosses on major indices often precede multi-month to multi-year bull runs. The indicator doesn’t guarantee gains, but the odds historically shows that investors who stay invested—or increase their exposure—after the signal typically see favourable outcomes.
- S&P 500 Historical Data: Golden Crosses have reliably signalled further gains, according to Dow Jones data. After a Golden Cross, the S&P 500 was higher one year later more than 71% of the time, with an average one-year return of more than 10%, according to data going back to 1928. By comparison, the average 12-month return for the index during any 12-month period since 1928 has been about 8%.
- ASX 200 Context: A recent Livewire Markets article points out that the ASX 200 formed a Golden Cross in April 2024. In the past, this signal has led to six to 12 month rallies for Australian equities, especially when macro conditions like easing inflation or rate pauses align.
The pattern is not infallible. False signals can and do happen—particularly in volatile, sideways markets. But in combination with improving fundamentals or supportive macro trends, the Golden Cross has a strong track record as a tailwind.
A Broader Look at Technical Analysis
The Golden Cross is just one tool in the broader discipline of technical analysis, which focuses on price action, trends, and momentum—rather than underlying fundamentals like earnings or valuations.
Other commonly watched indicators include:
- Relative Strength Index (RSI) – measures whether an asset is overbought or oversold.
- MACD (Moving Average Convergence Divergence) – tracks momentum and trend shifts.
- Support and Resistance levels – key zones where buyers/sellers tend to step in.
Technical analysts often use multiple signals together to reduce the risk of false positives. For instance, a Golden Cross might be more compelling if confirmed by rising volume, positive RSI momentum, or a breakout above key resistance.
Market Context: What the Golden Cross Signals
The recent Golden Cross in the ASX 200 aligns with a broader global trend. Several major indices—including the Nasdaq 100 and Germany’s DAX—have also flashed similar signals in the first half of 2025.
Driving this technical strength are several macro themes:
- Easing inflation pressures and the growing likelihood of rate cuts later in the year.
- Stronger-than-expected earnings, particularly in tech and infrastructure sectors.
- AI-driven investment and reindustrialisation narratives adding structural support.
While there’s always the risk of short-term pullbacks—especially given geopolitical risks or sticky inflation—the technicals suggest that equity markets may have more room to run in the second half of 2025.
How to Position: Strategies for Riding the Cross
So how can investors put the Golden Cross into practice? Here are several ways to participate in the trend—ranging from conservative to more growth-oriented:
1. Asset Allocation Tilt Toward Equities
If you’ve been overweight cash or fixed income during the volatility of 2023–24, a Golden Cross could be a signal to gradually increase equity exposure. This doesn’t require aggressive shifts—but even a modest reallocation from income to growth can improve participation in market upside.
Keep in mind:
Diversification remains key. Don’t abandon defensive assets entirely.
Rebalancing should align with your risk profile and time horizon.
2. Use Broad Market ETFs
One of the most accessible ways to tap into the momentum of a Golden Cross is through broad market ETFs that track indices likely to benefit from upward trends. These offer diversified exposure and can serve as a strong foundation in a portfolio.
- Broad Market ETFs (Australia): VAS, A200, IOZ, STW, MVW
- S&P 500 / Global ETFs: VTS, IVV, SPY, U100, VOO
- Nasdaq / Thematic ETFs: NDQ, FANG, HACK, IOO, CLDD
These are just examples, and I can help build a tailored portfolio using a mix of these ETFs along with selected individual stocks—aligned to your goals and risk profile.
3. Thematic or High-Alpha Sector Plays
For investors comfortable with higher risk, thematic ETFs or high-conviction sectors that are leading the rally can amplify returns. Examples:
- FANG+ ETFs (e.g., FANG) which capture big tech momentum.
- Semiconductor ETFs (e.g., SEMI) riding the AI hardware boom.
- Clean energy or infrastructure ETFs, if macro spending supports those sectors.
These tend to outperform in bull markets, but they come with higher volatility—so position sizing is key.
4. Momentum-Driven Rotation Strategies
Some investors choose to rotate into sectors or assets with the strongest momentum. Tools like relative strength charts or moving average screens can help identify leaders vs laggards. For instance:
- Financials and industrials may benefit from economic expansion.
- Tech and communication services often lead early-stage bull markets.
- Defensive sectors like utilities may lag during these phases.
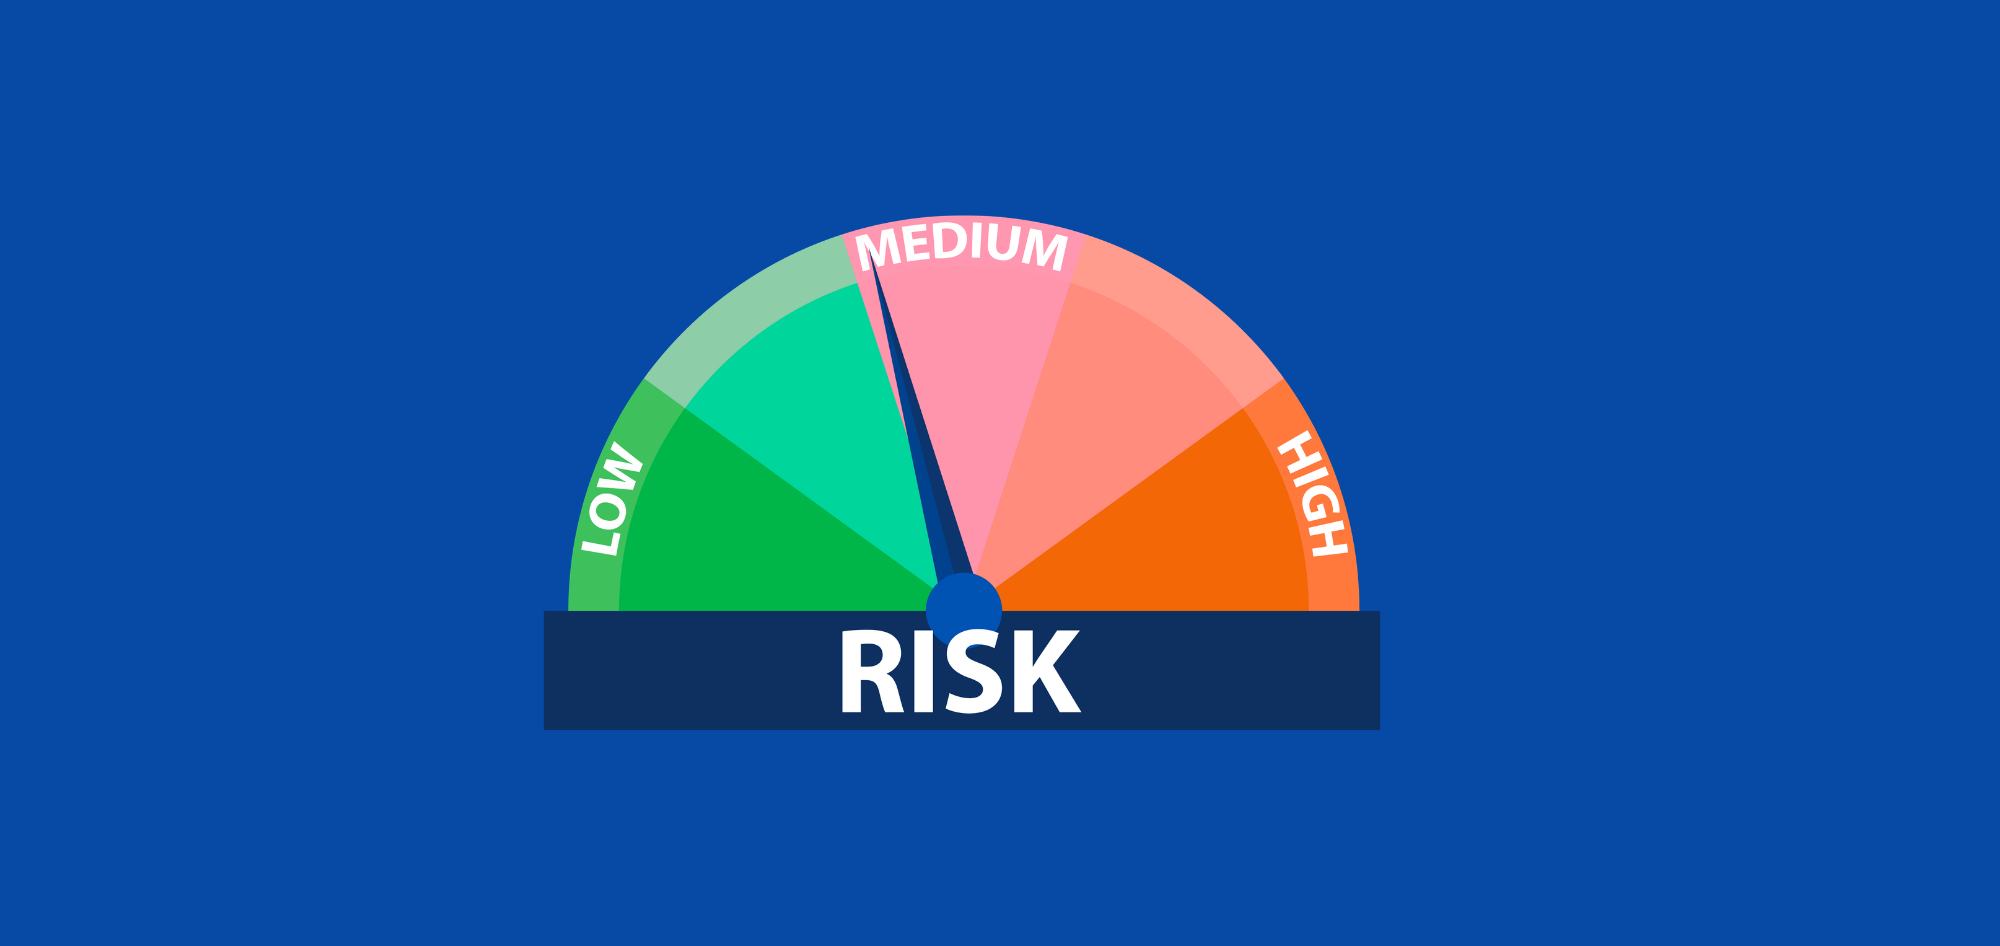
| RISK | WHAT TO WATCH | |
|---|---|---|
|
Geopolitics |
Ukraine, Middle East, Taiwan tensions |
Trade Wars |
RISK
WHAT TO WATCH
Geopolitics
| RISKS | WHAT TO WATCH |
|---|---|
| Geopolitics | Ukraine, Middle East, Taiwan tensions |
| Trade Wars | US-China tariffs, Mexico sanctions |
| Sticky Inflation | Especially in energy and services |
| Growth Concerns | Weakening consumer demand |
| US Debt | $1.9T deficit + $1T in interest payments |
| Climate Risk | Infrastructure damage and supply chain disruption |
| Valuation Risk | Over concentration in megacap tech |
Final Word: The Golden Cross Is a Signal, Not a Crystal Ball
While the Golden Cross has a compelling historical track record, it’s not a guarantee. Like any technical tool, it works best when supported by broader macro tailwinds, improving sentiment, and solid fundamentals.
That said, in the current environment—where inflation is moderating, AI innovation is accelerating, and equity markets are recovering—the signal may be pointing to opportunity.
Whether you choose to increase equity allocation, rotate into momentum ETFs, or simply stay the course, the Golden Cross reminds us that markets move in cycles—and sometimes, the charts really do tell a story.

Tony Raikes
CPA. B.Acc Dip.FP Grad.Cert.Mgt
Private Client Advisor
Authorised Representative No. 00448193
Prince Wealth Founder and Financial Adviser Tony Raikes utilises a variety of advanced risk management strategies to protect clients’ portfolios and is dedicated to providing a comprehensive financial planning experience, empowering clients to make confident and informed decisions about their financial future.